Tables on Selected Education Indicators in KP 2004-05 to 2015-16
by Muhammad Saleem (Twitter @memzarma )
There is a renewed focus on KP education performance both in the mainstream media and on social media. While some of the commentators do speak about it based on authentic data, others (and they are in the majority) do not have a clue when speaking about education performance in KP. To have an informed debate, I tried to compile a few tables on the few important education indicators. These are all outcome indicators, which are a result of government policies in education sectors and the overall socio-economic environment in the province. The data here is presented with the hope that people may be able to participate in a more informed debate. The data is of 3 different regimes in the province so one can compare different political government performance as well.
Following are tables on selected education indicators in Khyber Pakhtunkhwa over the years [from 2004-05 to 2015-16]. The data is taken from the annual Pakistan Social & Living Standard Measurement (PSLM) surveys available here at http://www.pbs.gov.pk/content/pakistan-social-and-living-standards-measurement collected by Pakistan Bureau of Statistics. This PSLM survey exercise was initiated, among other things, to track on the MDGs in Pakistan. As per PBS explanation, the data pertaining to each year is collected for the same year, though the reports came out late. For example, the data for the year 2015-16 is collected between September 2015 and June 2016. The data for the year 2009-10 & 2015-16 is not available for all indicators as it is not readily available on the PBS website. Some missing data points for these two years were looked into different issues of Economic Survey of Pakistan. The last table [Table 14] is headcount poverty measure taken from the UNDP report on Multidimensional Poverty Index (MPI) and is available here.
http://www.pk.undp.org/content/pakistan/en/home/library/hiv_aids/Multidimensional-Poverty-in-Pakistan.html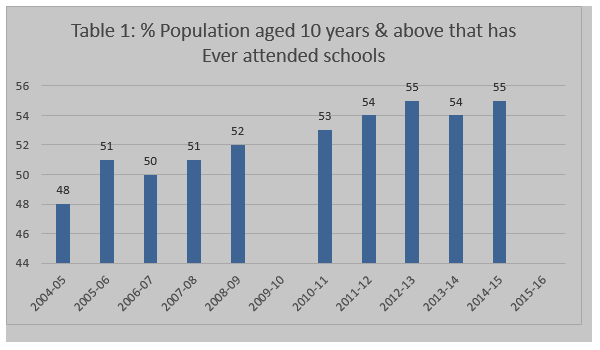
Notes for Table 1: (A) Population aged 10 years and older that has ever attended school as a percentage of the total population aged 10 years and older. (B) Attended School: All those individuals who have ever attended school (either currently attending, or attended in the past) were taken to have attended school.


Notes for Table 4: This is the main table, which is taken as the normal primary level enrolment rate and which the government pledged to increase it to 100% as per the MDG goals and now the SDGs. Economic Survey of Pakistan also report this table regularly each year in its annual reports.


Notes for Table 6: This table depicts a picture of government-run primary schools. Any improvement in government schools will show its results here.

Notes for Table 7: Again, this tables shows that how much of school going kids go to government-run primary schools. The table shows that over the years, enrolment in government schools is on the decline. The year 2005-06 is seems to be an outlier. In 2006-07, Only 21% kids were enrolled in private schools out of total enrolled kids which is now at 31%.

Notes for Table 8: In 2004-05, 78% of the total enrolled kids were going to government schools, which now drops to 68%. Every year in KP, government schools loose out 1% of its enrolment to private schools. Multiple reasons are here to be blamed such as missing facilities in government schools, less government schools (especially girls’ schools) as against the demand and low quality of the government-run schools. There is a caveat to the last one though: Most of the private primary schools are no better than the government schools in terms of quality education but then due to ‘the culture of admitting kids in private schools as a symbol of status’, most middle class parents send their children to private schools. This is off course anecdotal (the write observe this in district Swabi where 90% of the private schools results in the SSC exam was as poor as government run high schools) and a proper research in this area is needed.


Notes for Table 13: (A) Population aged 10 years and older that is literate expressed as a percentage of the population aged 10 years and older. (B) Literacy: For all surveys, literacy is taken as the ability to read a newspaper and to write a simple letter.

This table is taken from the UNDP report of 20th June, 2016 on the Multidimensional Poverty Index (MPI) which is being calculated with the data taken from PSLM surveys. The MPI index is a composite index calculated from various indicators of education, health and living conditions. The overall weightage given to these three variables is equal (1/3 of total) which is further divided into the following sub-variables.
